Academic Edition — Start Free, Publish with Confidence

EmoFEAT
Text Emotion Analysis Platform

Not just analysis — a defensible pipeline from raw text to peer review.

From a YouTube URL to 28-emotion deep learning analysis, the statistical tests SCIE papers require, and a Methods draft — without a single line of code.

Need raw data first? Collect YouTube comments directly and use them for GoEmotions or NLP analysis.

Collect Comments

Designed to survive peer review.

Validation

Can you report a reliability coefficient for your emotion analysis?

Blinded sample coding is built in — Cohen's κ, Krippendorff's α and a confusion matrix are computed automatically against your human coders.

Reproducibility

The same result, six months later.

Model version, thresholds, seeds and package versions ship inside every result Excel. Coding delegated to an LLM may not reproduce next month — a pinned model with a recorded manifest does.

Methods

A Methods section you can paste.

An EN/KO draft describing exactly — and only — the analyses you actually ran, generated automatically.

What statistical reviewers ask for is already built in:
BH-FDR multiple-comparison correction · Hedges' g with bootstrap CIs · Newey-West HAC · MDES design sensitivity (Hoenig & Heisey 2001) · PPMI filtering (Church & Hanks 1990)

One URL → a publication-ready dataset

Did public sentiment really change after the event? Answer statistically — interrupted time series with Newey-West HAC errors and PELT changepoint detection.

1

Collect

YouTube comments by URL

2

Clean

Bot & duplicate filtering

3

Analyze

28-emotion deep learning

4

Test

ITS + PELT changepoints

5

Validate

Human-coder κ / α

6

Report

21-page report + Excel

What Takes Researchers Days, We Do in Seconds

15 interactive figures, 10 statistical tables, and 6 advanced analyses — ANOVA, clustering, entropy, logistic regression — all auto-generated into a 21-page report.

This is what a team of statisticians would produce in a week.
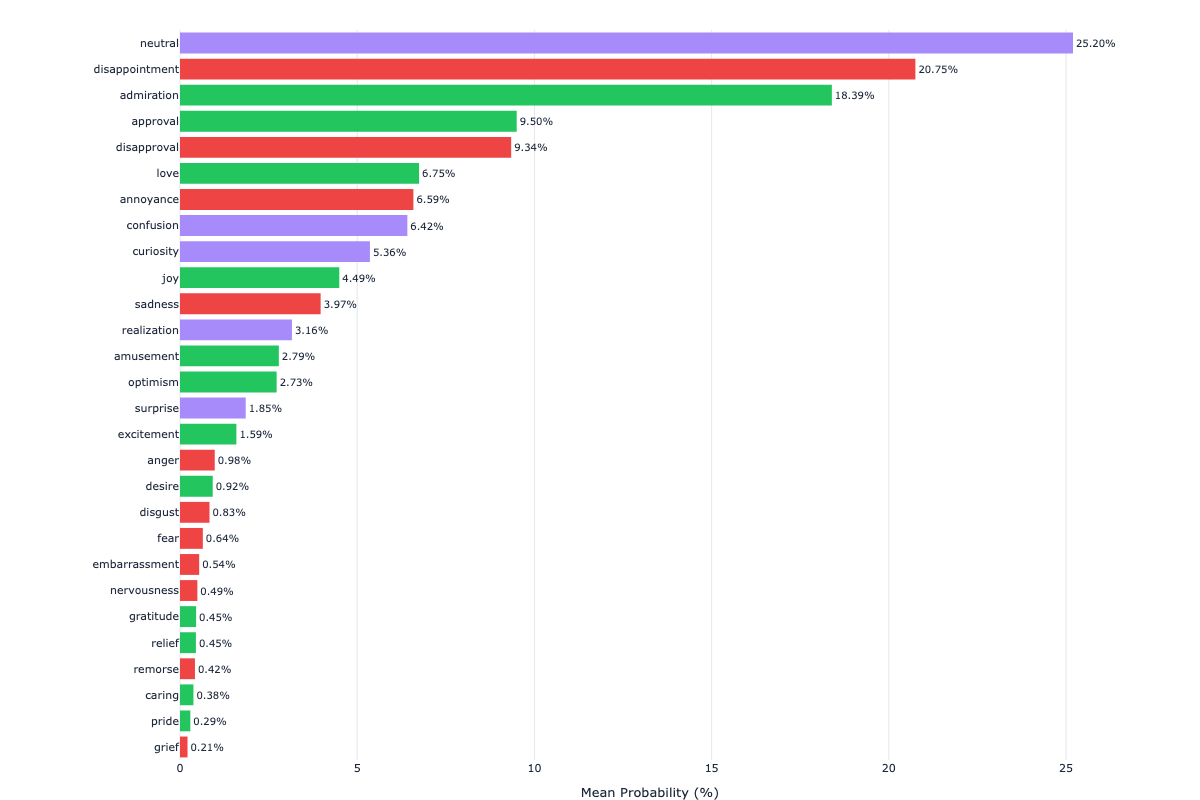
EmoFEAT 28-emotion probability distribution bar chart showing RoBERTa GoEmotions analysis results

28-Emotion Probability Distribution

Mean probability ranking across all 28 GoEmotions
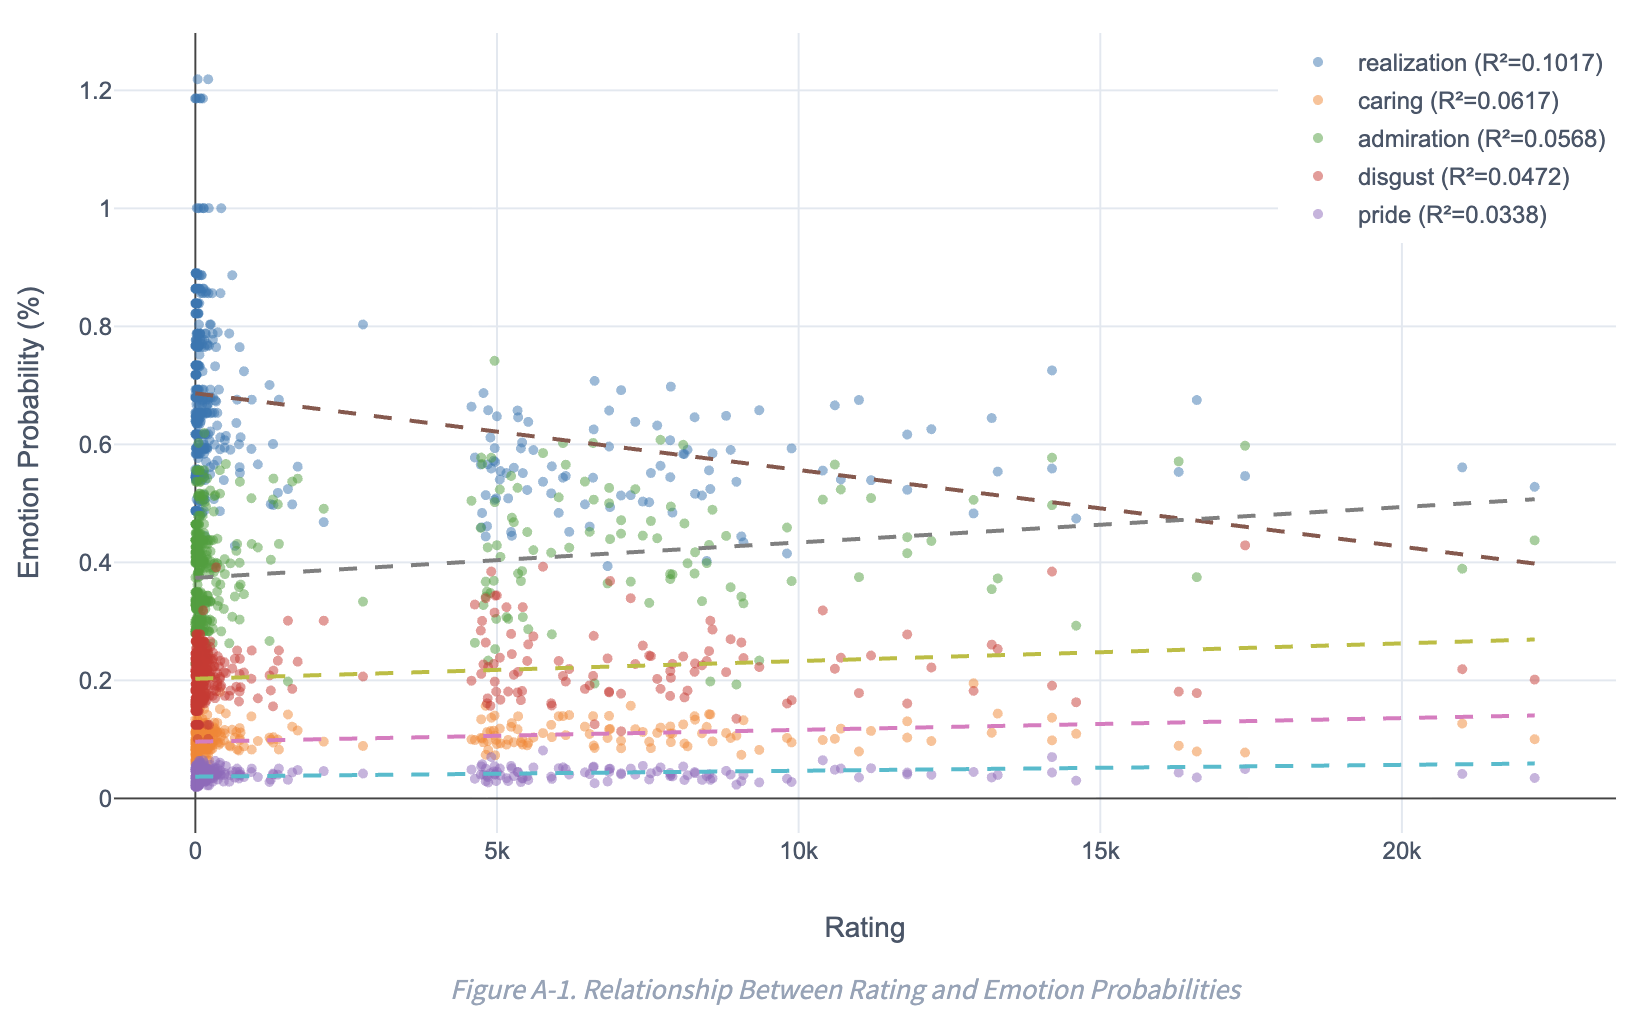
EmoFEAT rating-emotion correlation analysis with ANOVA and Tukey HSD post-hoc tests

Rating-Emotion Analysis

ANOVA, Pearson/Spearman correlation, and Tukey HSD post-hoc tests
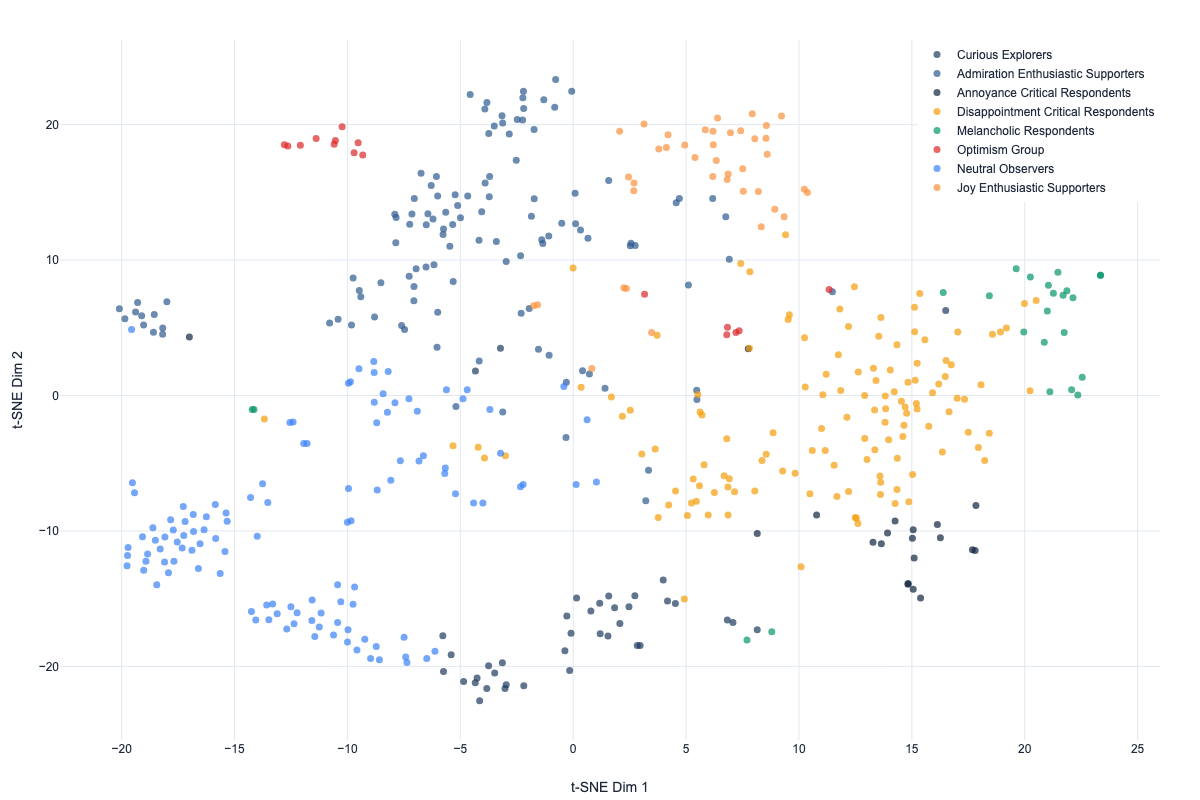
EmoFEAT K-Means clustering with t-SNE dimensionality reduction visualization

K-Means Clustering + t-SNE

Automatic cluster labeling with dimensionality reduction
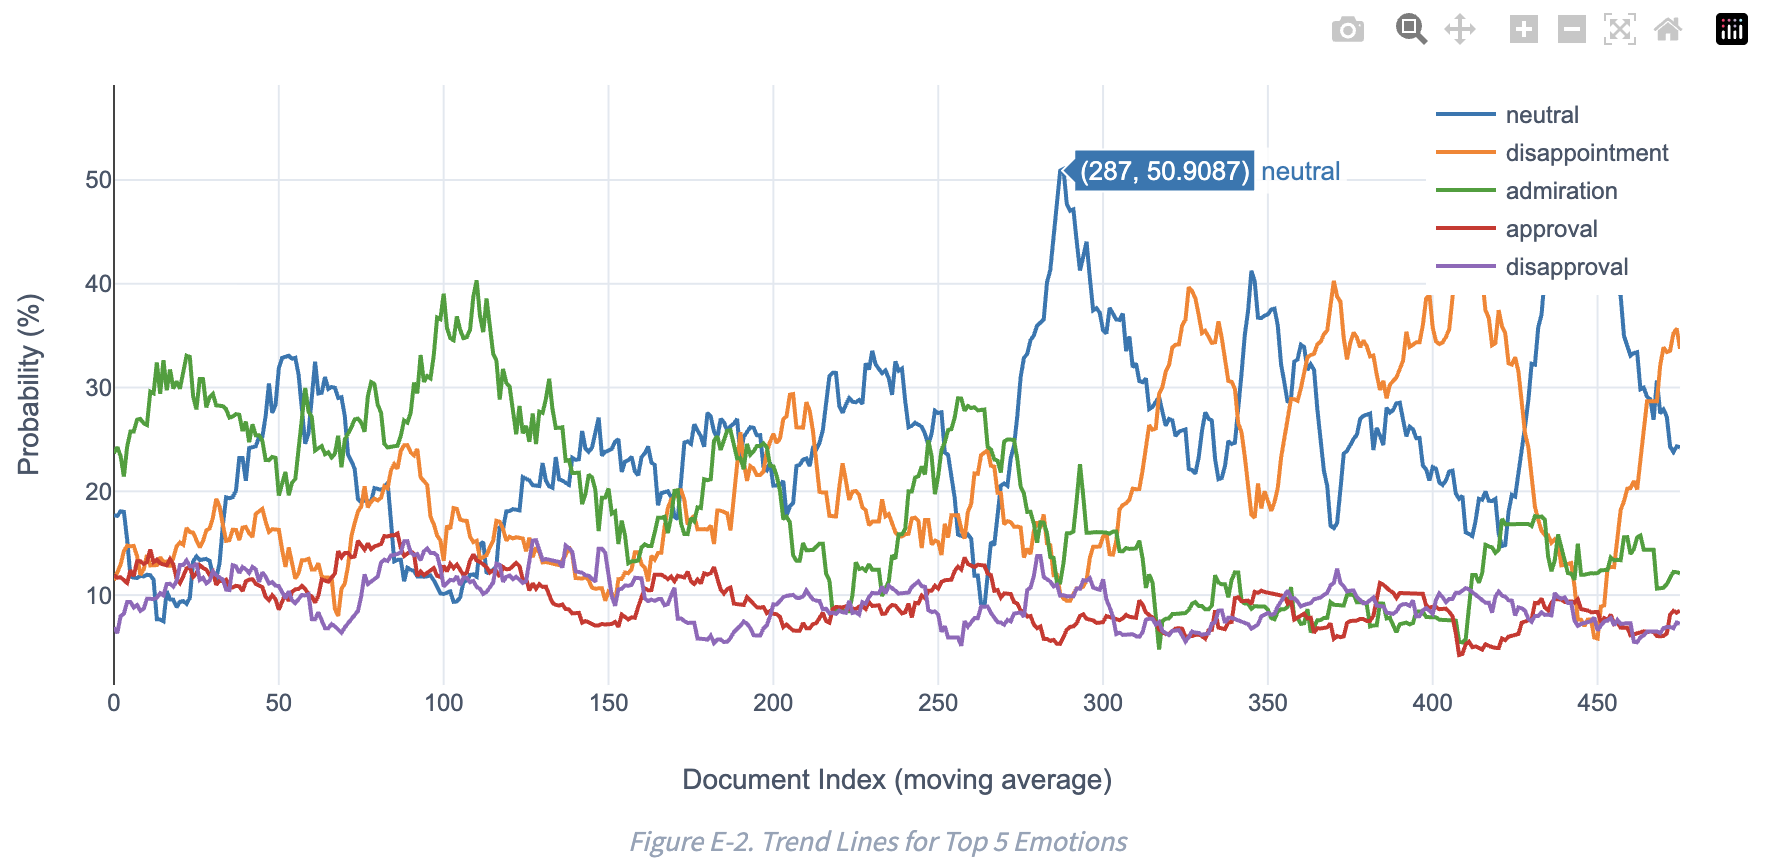
EmoFEAT temporal emotion transitions trend lines for top 5 emotions

Temporal Emotion Transitions

Emotion distribution changes over time
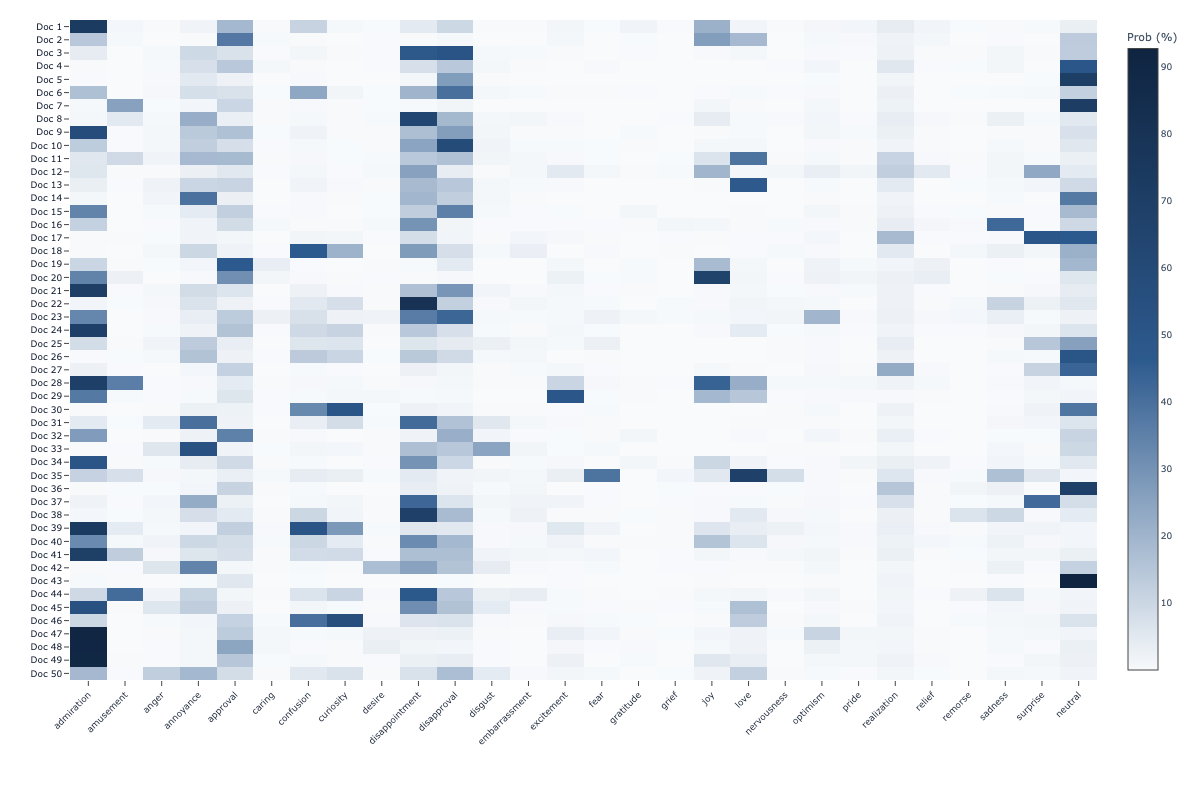
EmoFEAT document-emotion probability heatmap showing 28 emotions across documents

Document-Emotion Heatmap

Per-document emotion probability matrix
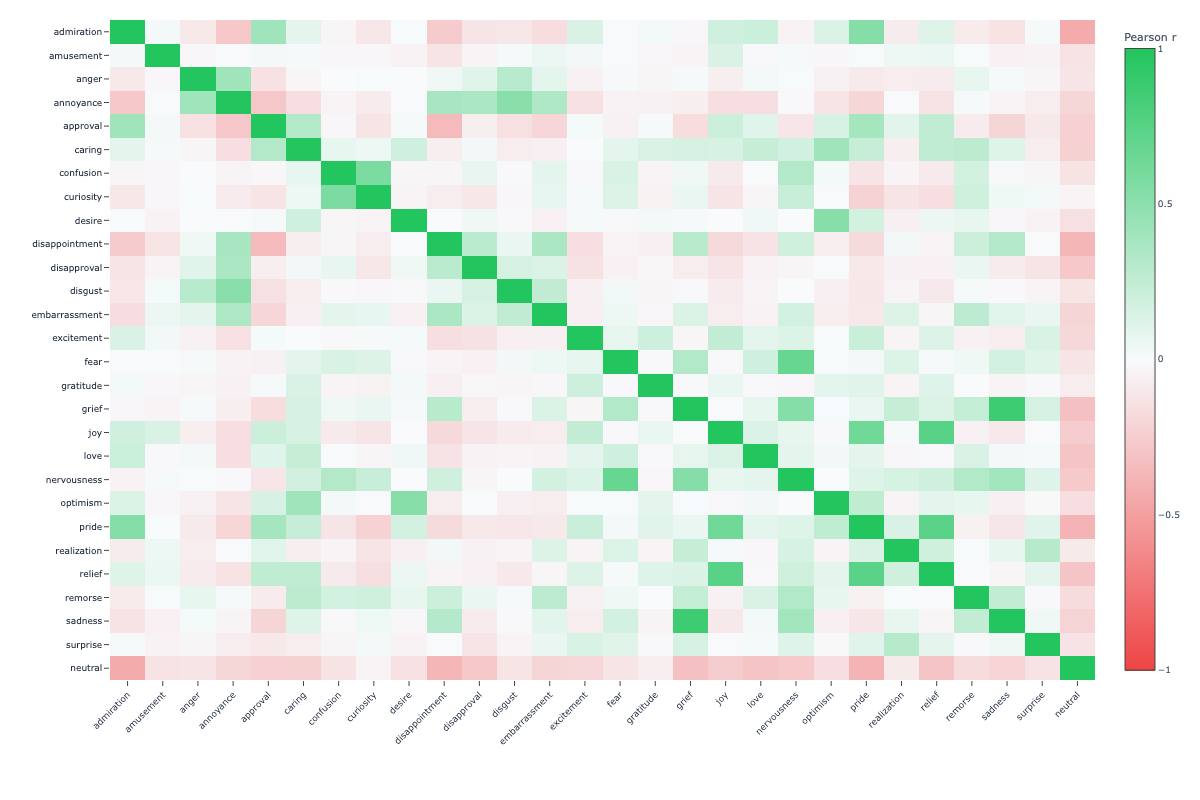
EmoFEAT Pearson correlation matrix between 28 emotion dimensions

Emotion Correlation Matrix

Pearson r between all 28 emotion pairs
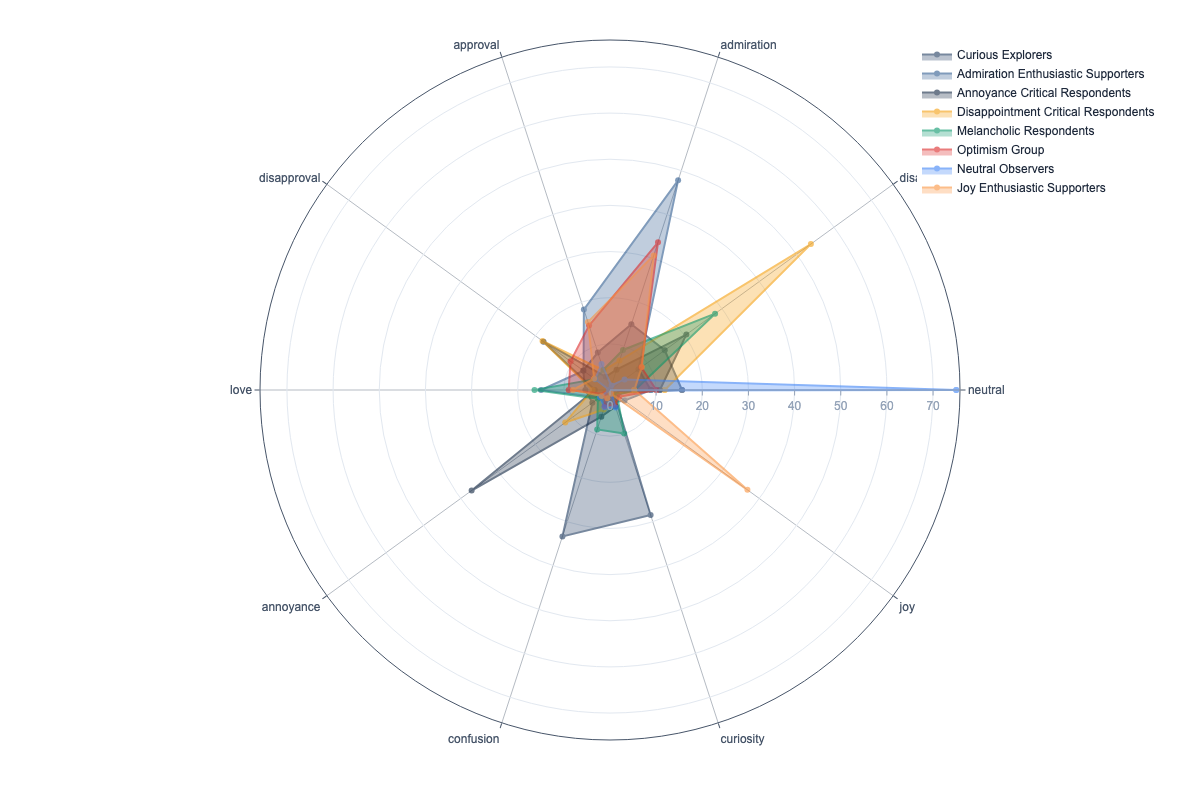
EmoFEAT cluster emotion profiles radar chart comparing emotion signatures

Cluster Emotion Profiles

Radar chart comparing cluster emotion signatures
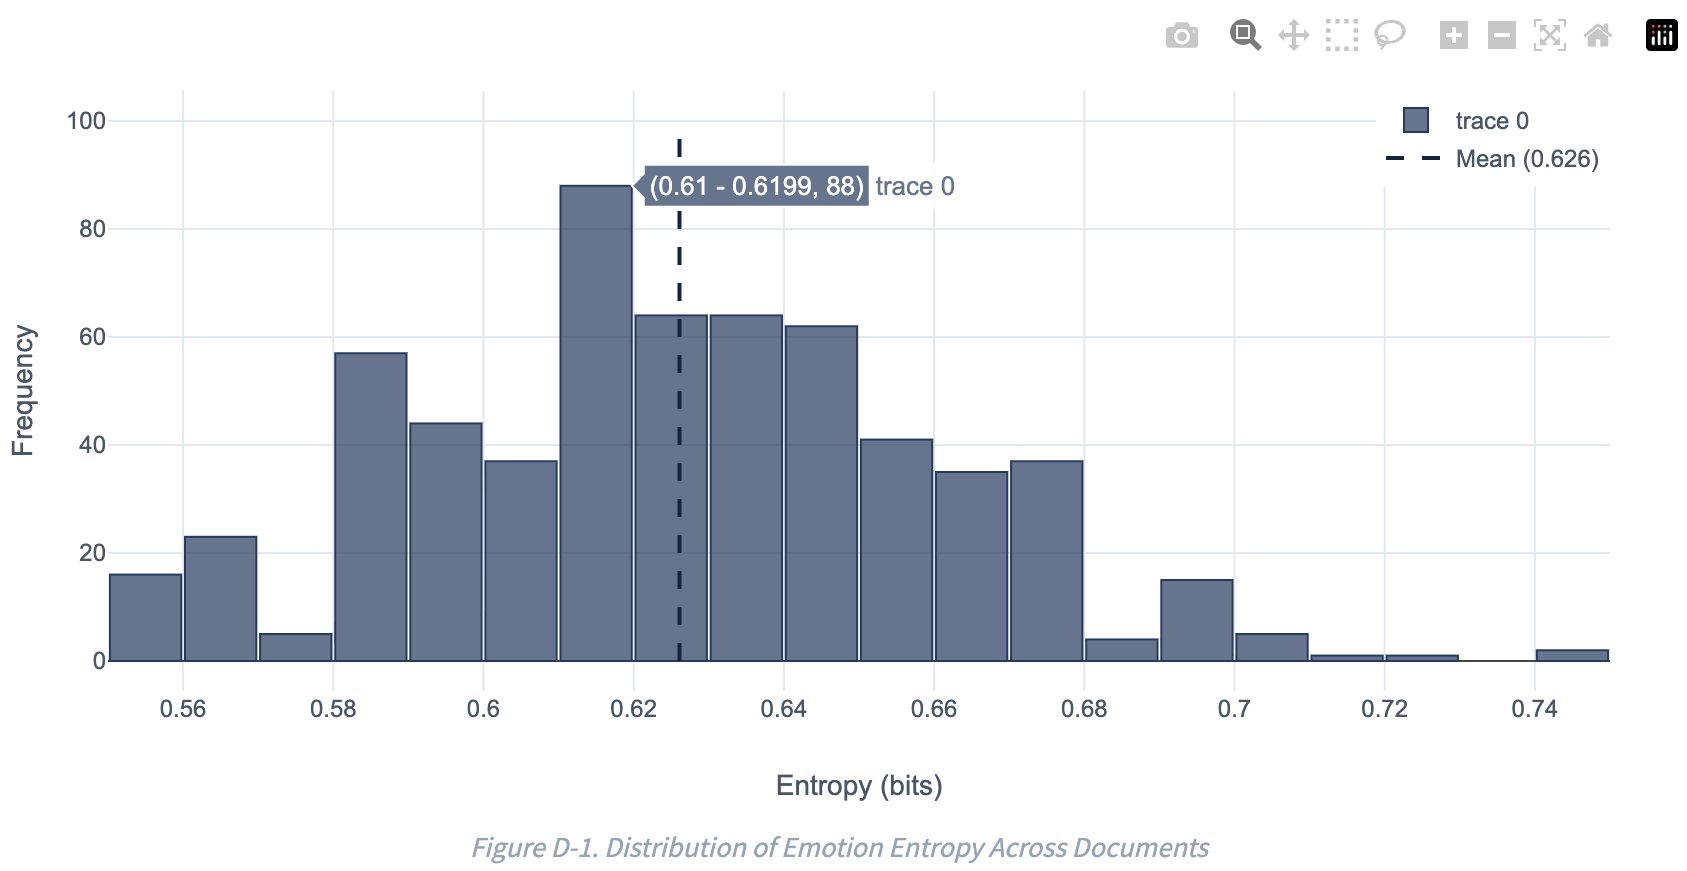
EmoFEAT Shannon entropy distribution with Mann-Whitney U statistical test

Emotion Entropy Analysis

Shannon entropy distribution with Mann-Whitney U test
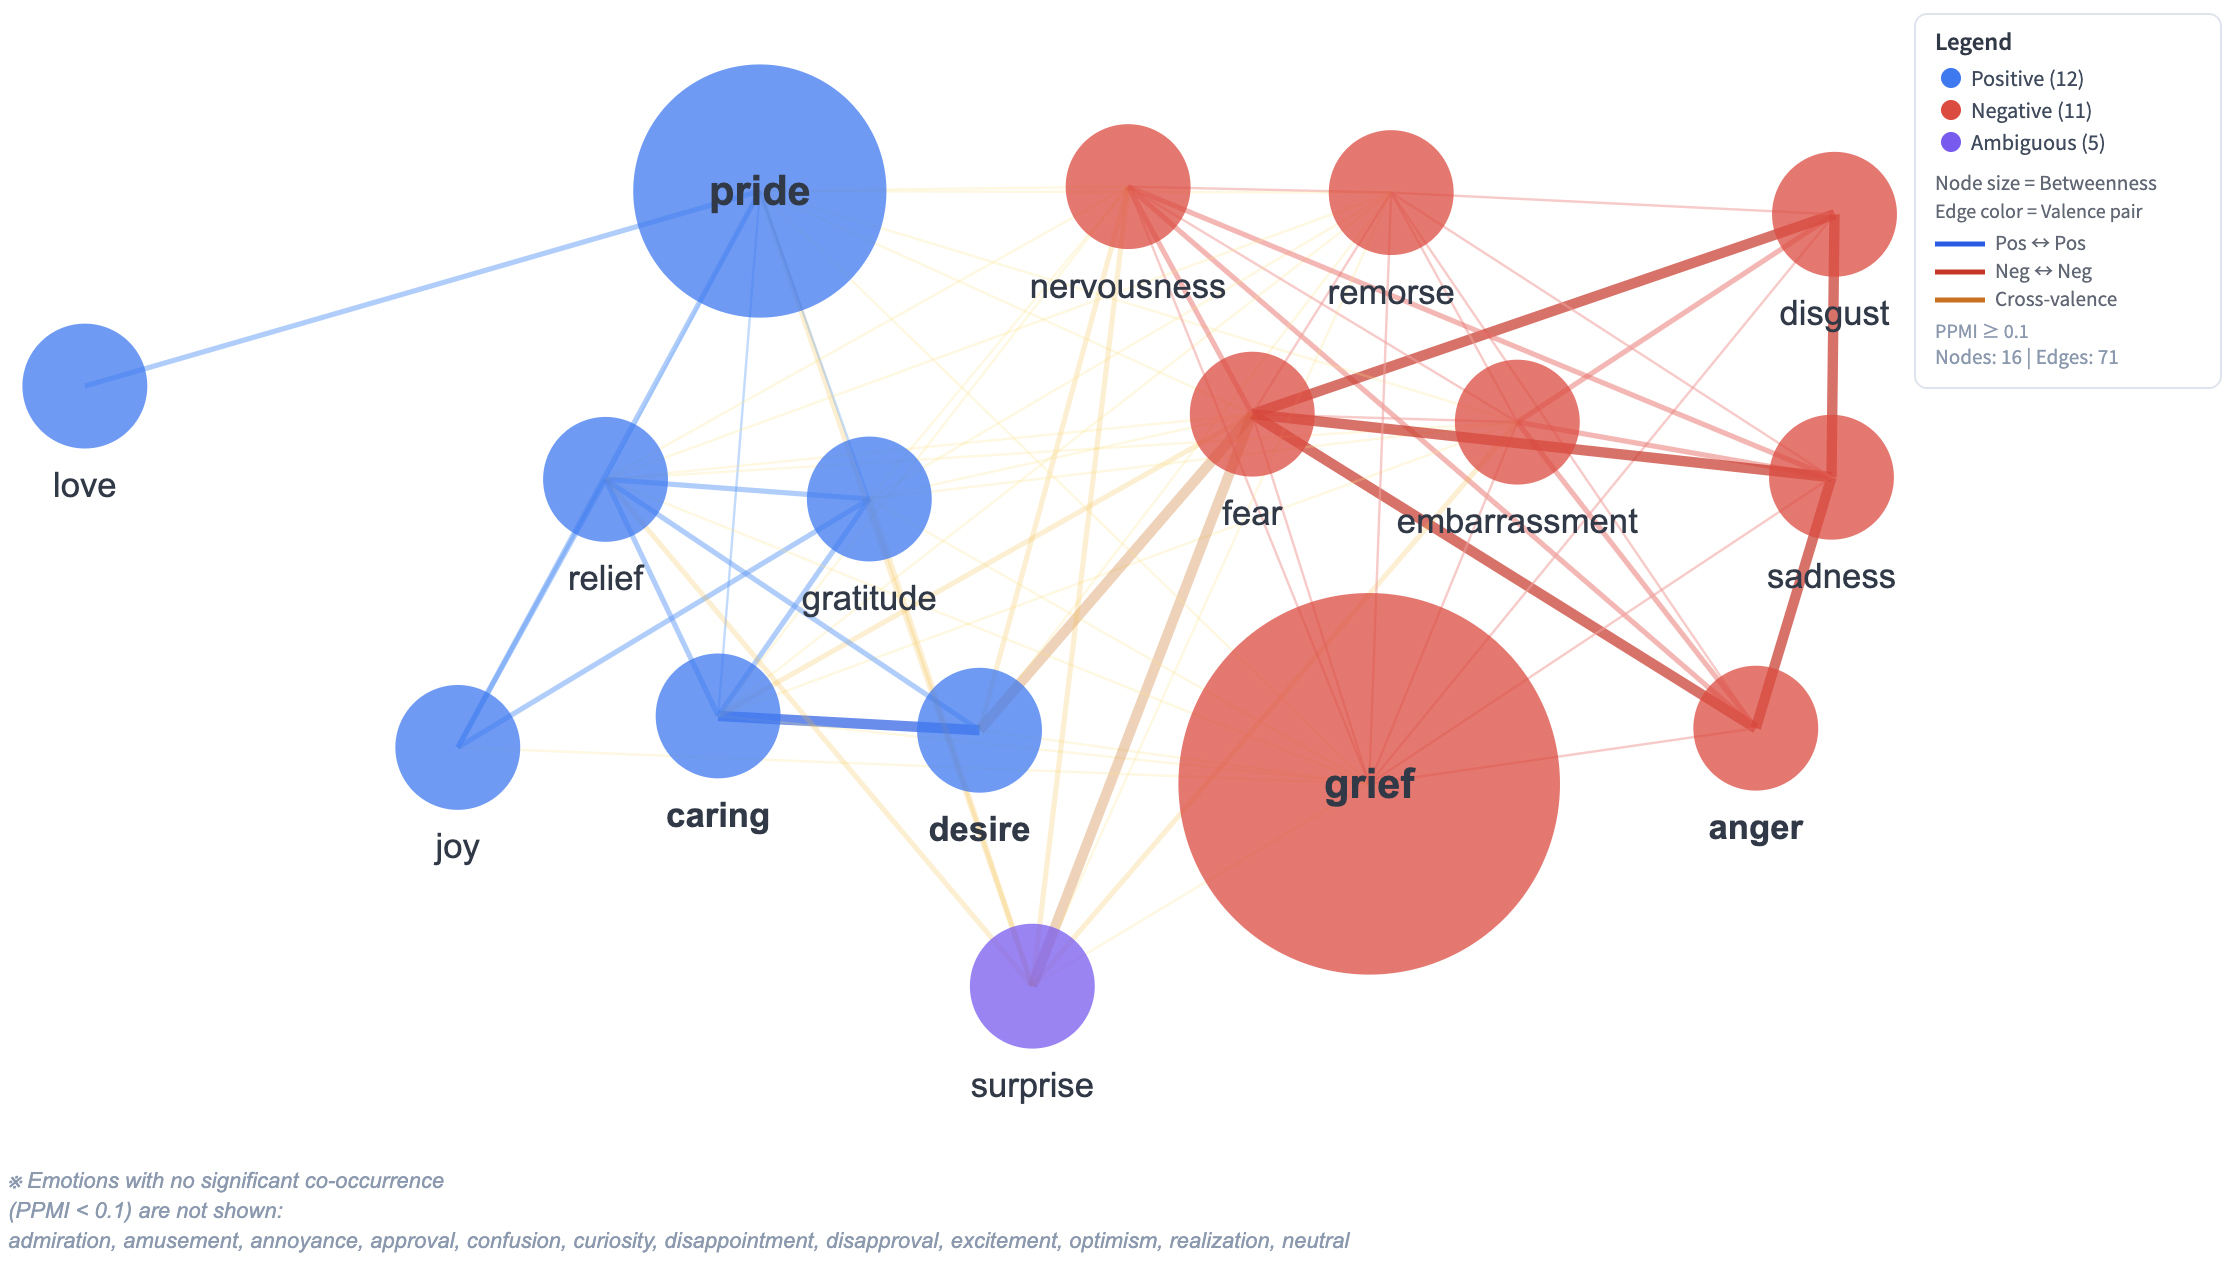
EmoFEAT PPMI-based emotion co-occurrence network with force-directed layout showing positive, negative, and ambiguous emotion clusters

Emotion Co-occurrence Network

PPMI-filtered force-directed graph showing emotion cluster structure and centrality
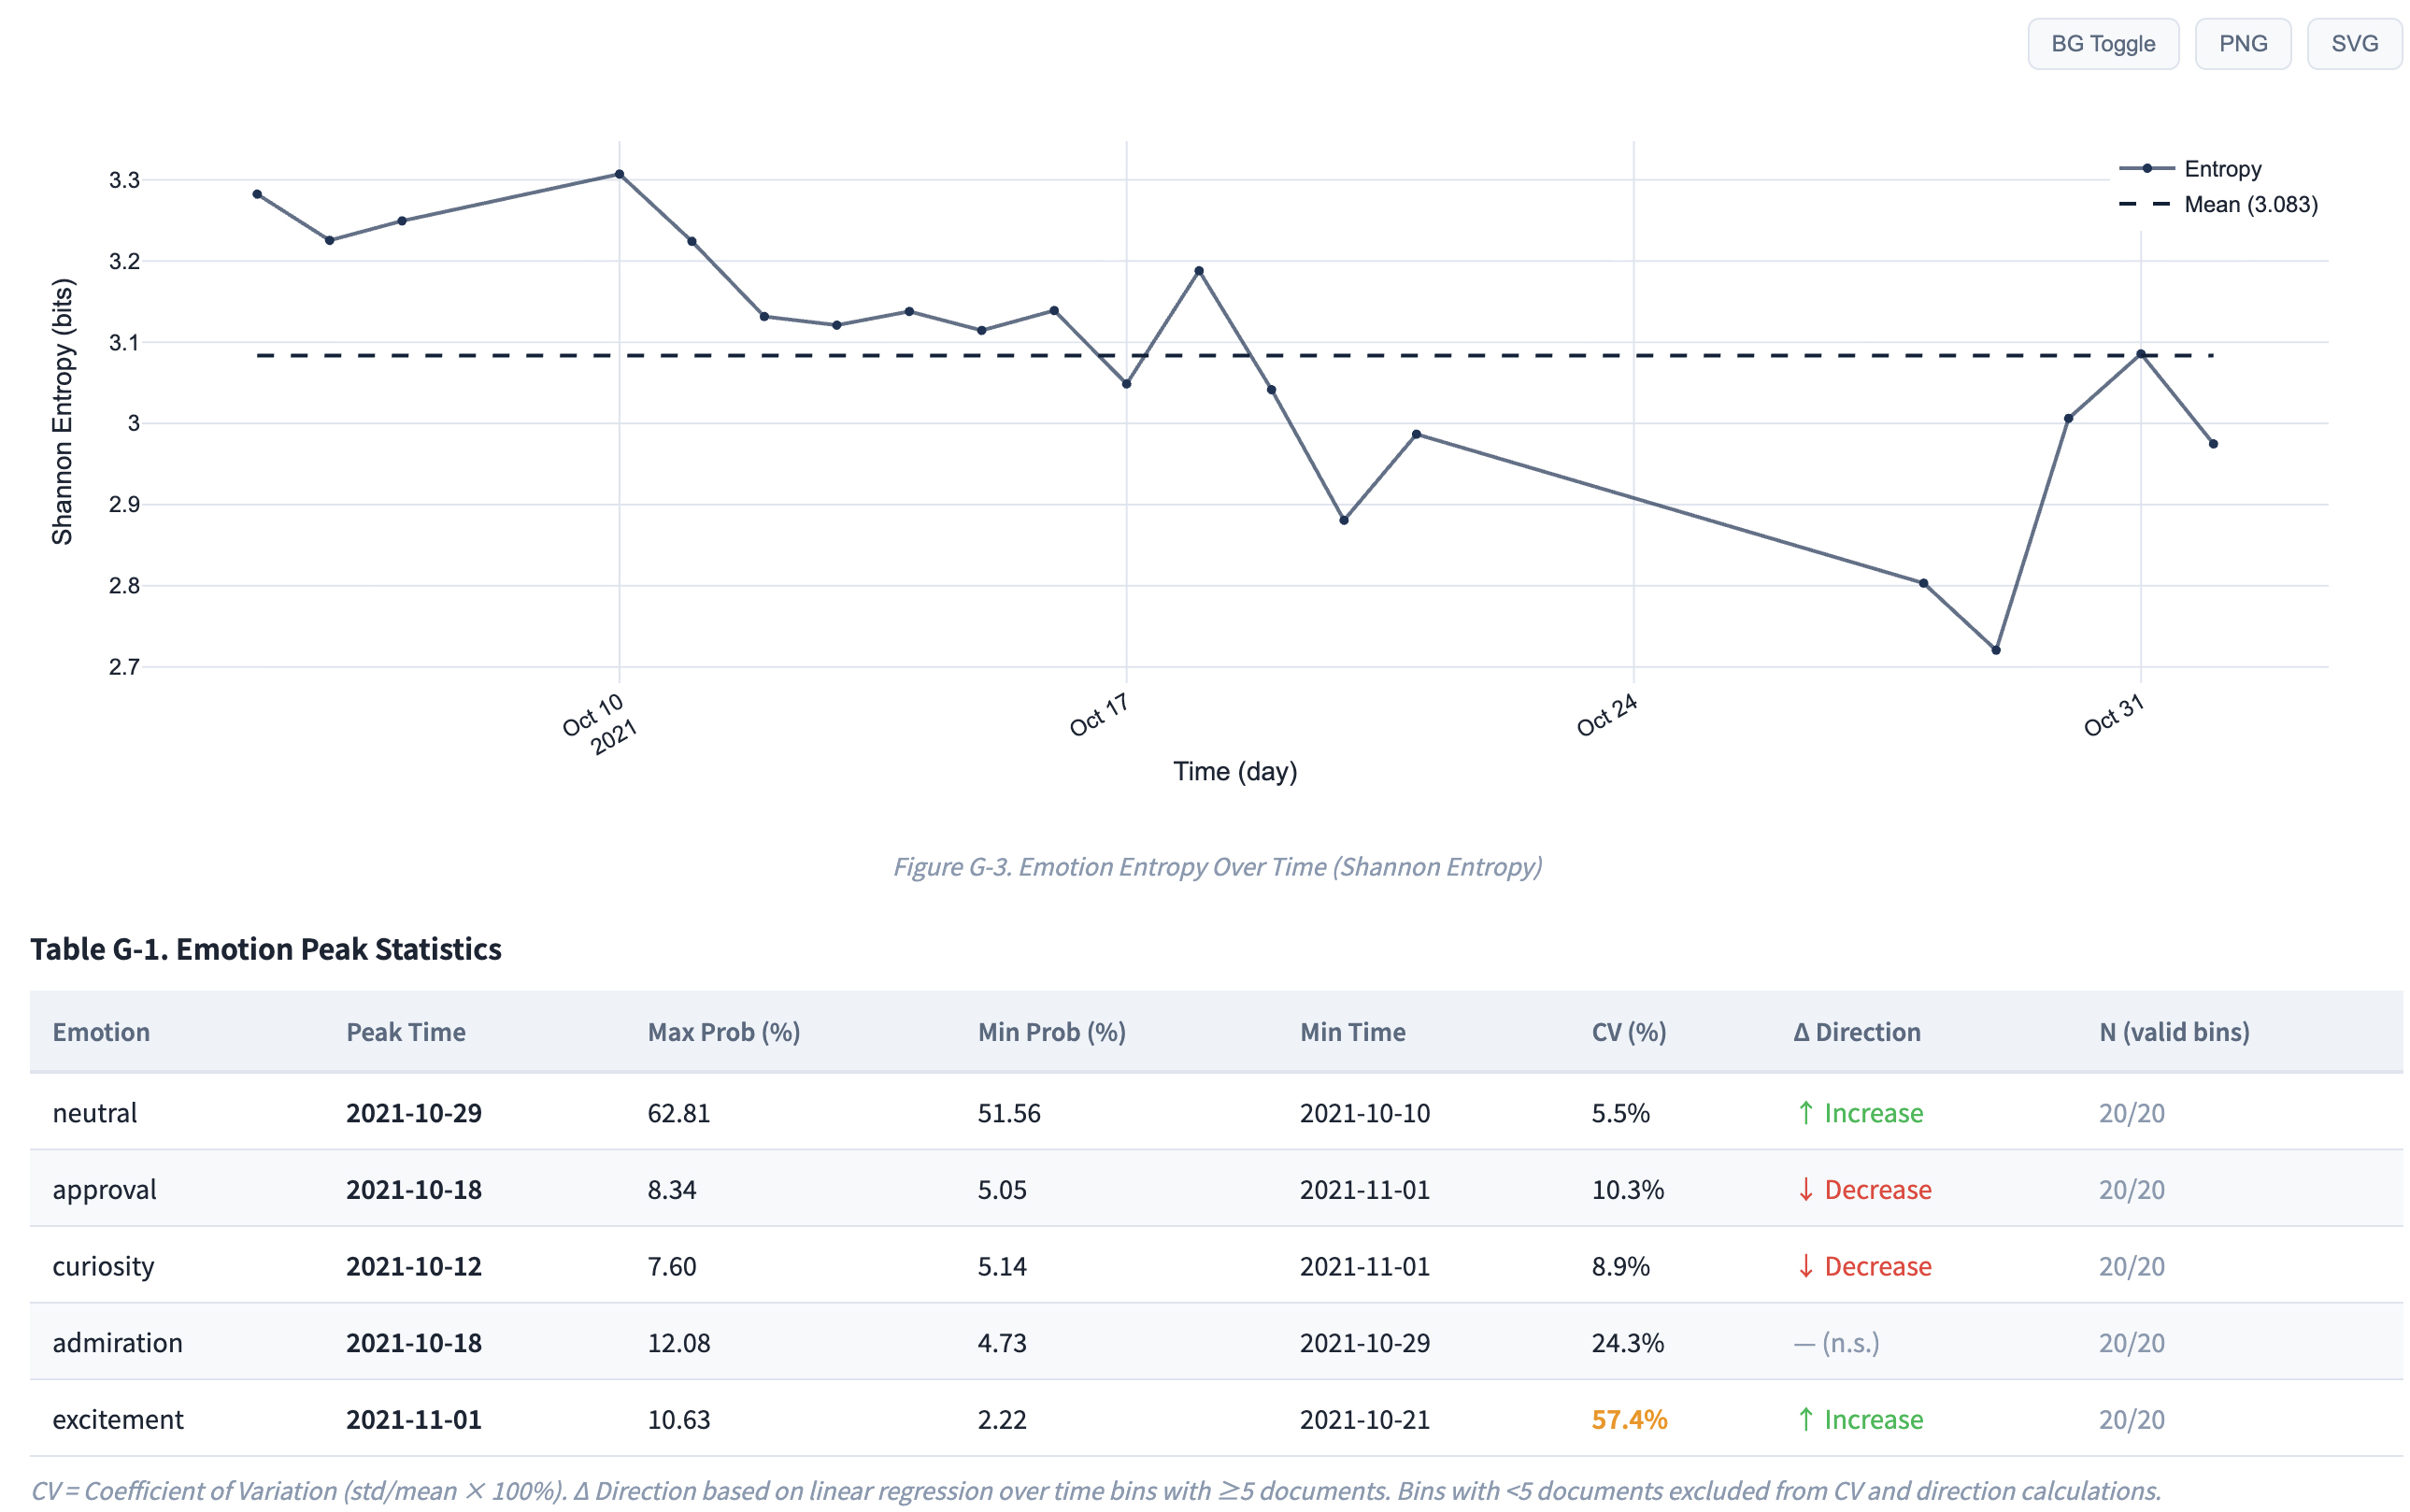
EmoFEAT Shannon entropy over time line chart with emotion peak statistics table showing temporal emotion dynamics

Temporal Emotion Entropy

Shannon entropy over time with emotion peak statistics table
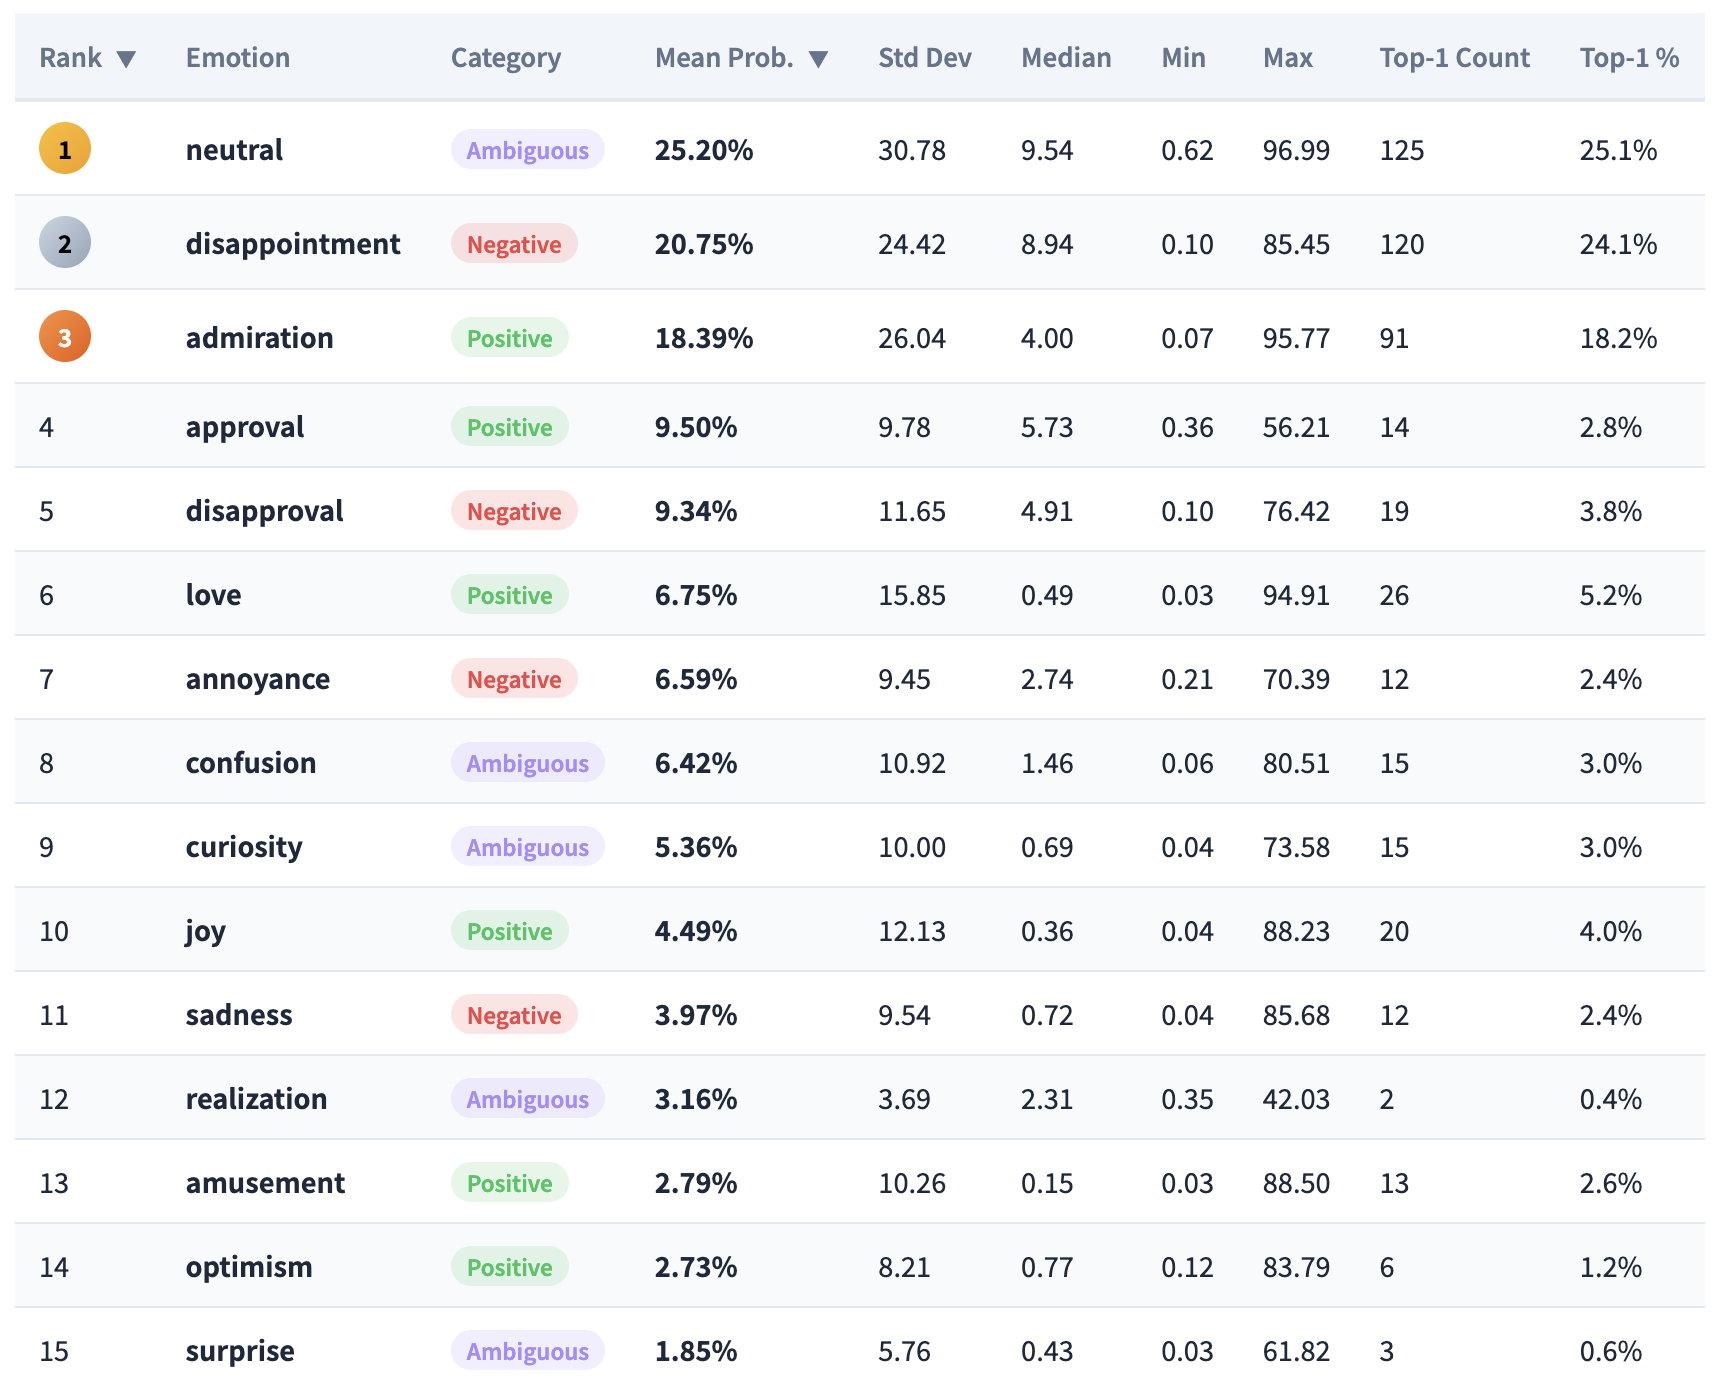
EmoFEAT comprehensive descriptive statistics table for 28 GoEmotions

Detailed Emotion Statistics Table

Comprehensive descriptive statistics for all 28 emotions
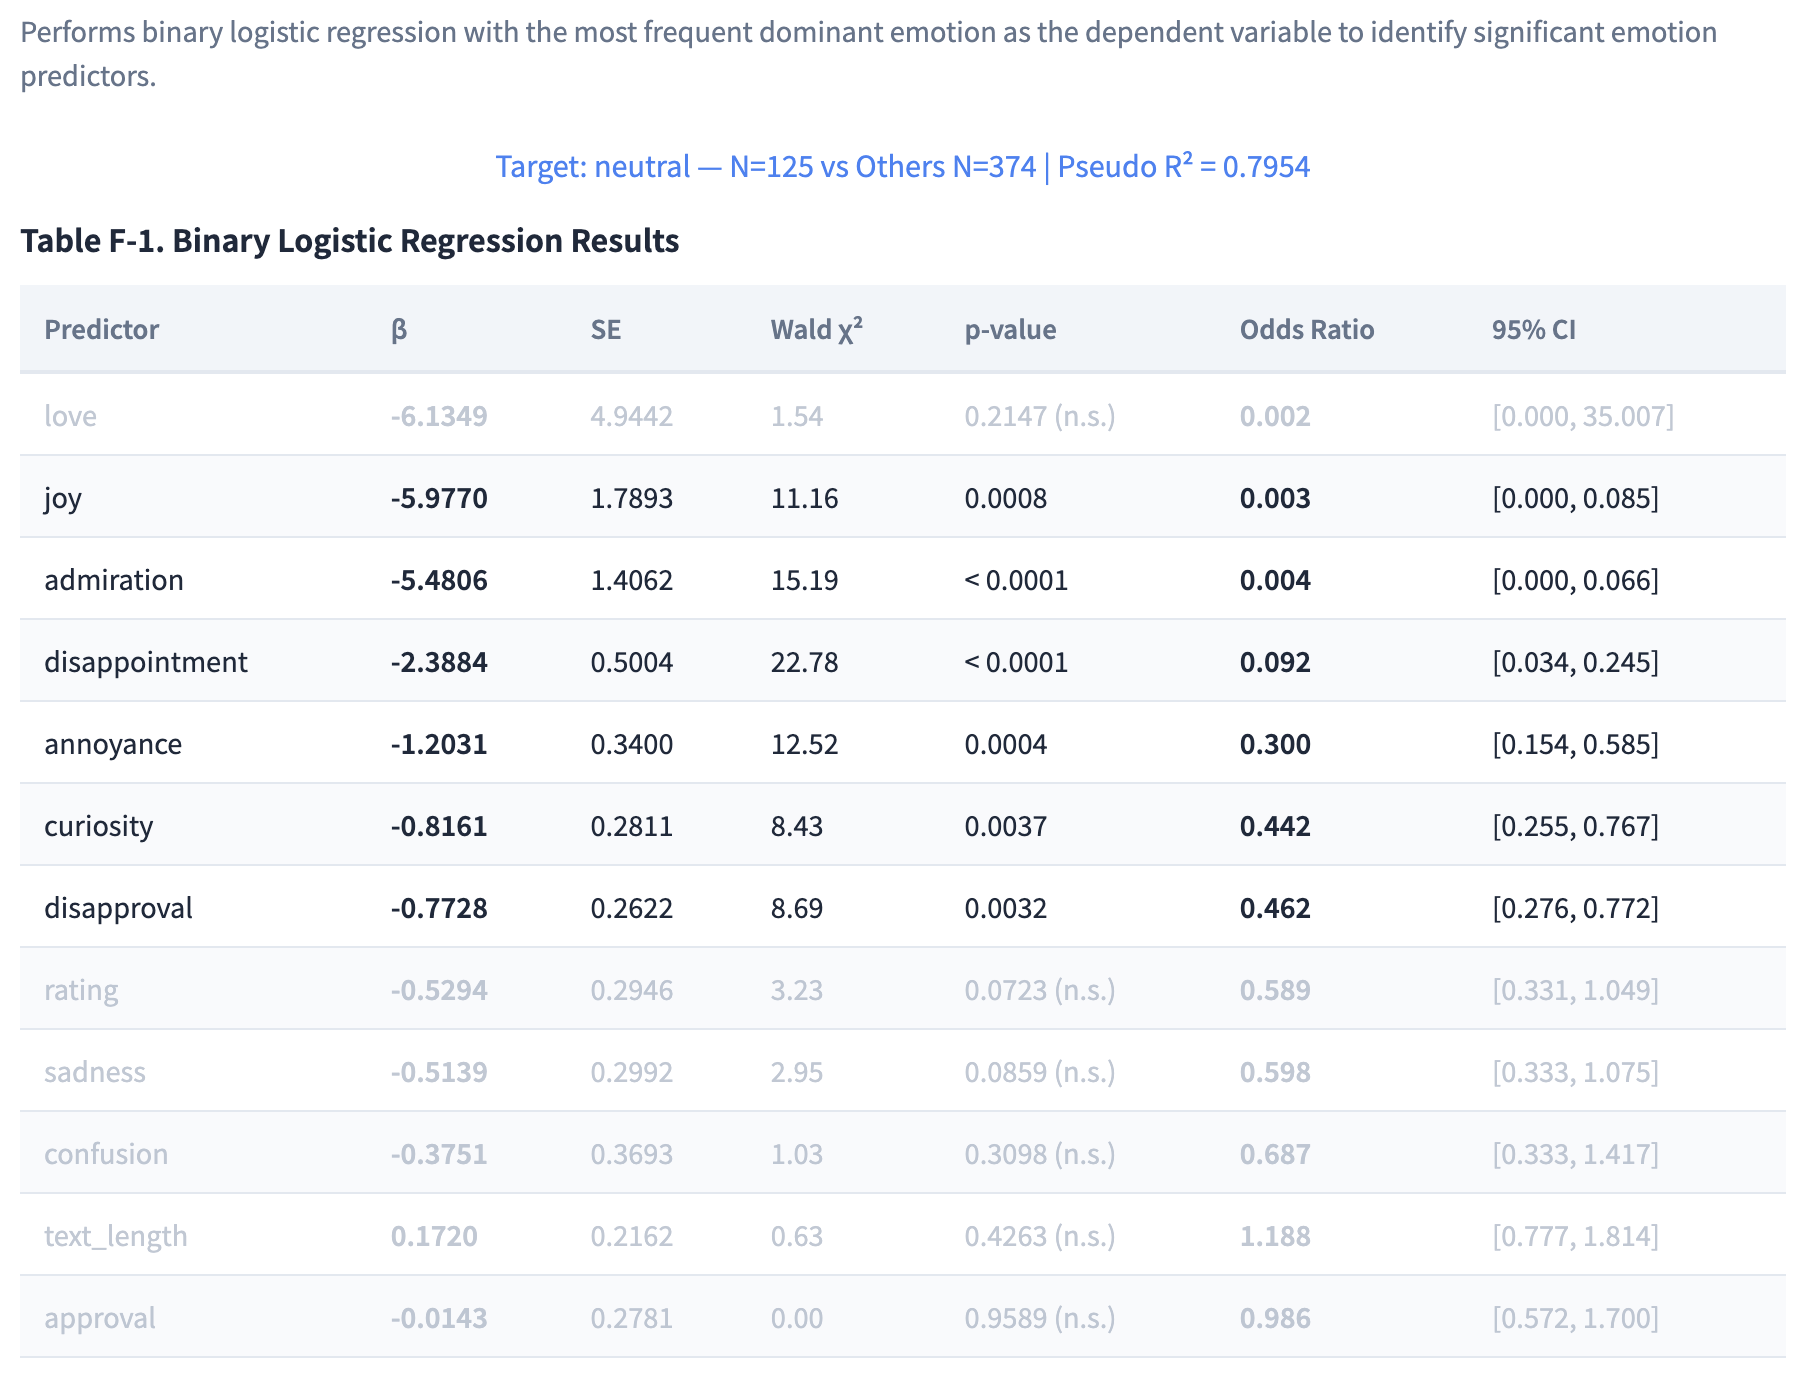
EmoFEAT binary logistic regression identifying significant emotion predictors

Emotion Predictor Analysis

Binary logistic regression identifying significant emotion predictors

How It Works

From raw data to publication-ready analysis in 8 automated steps

1
Upload
CSV / XLSX / TXT
2
Select Columns
Text + Rating / Date
3
Preprocessing
Clean & normalize text
4
RoBERTa Inference
28 emotions per document
5
Statistics
Mean, SD, Median, Min/Max
6
Categorization
Positive / Negative / Ambiguous
7
Advanced Analysis
ANOVA, Clustering, Entropy, Regression
8
Export
15 charts + Excel + PDF

GoEmotions 28 EMOTION CATEGORIES

Positive (12)

admiration · amusement · approval · caring · desire · excitement · gratitude · joy · love · optimism · pride · relief

Negative (11)

anger · annoyance · disappointment · disapproval · disgust · embarrassment · fear · grief · nervousness · remorse · sadness

Ambiguous (5)

confusion · curiosity · realization · surprise · neutral

8-Step Preprocessing Pipeline

Systematic text preprocessing for reliable and reproducible analysis results

1
Text Extraction
Extract text from CSV, Excel, TXT or PDF
2
Special Characters
Remove special characters, URLs, HTML tags
3
Numbers / Dates
Optionally remove numbers and dates
4
Morphological Analysis
Korean: KoNLPy (Okt/Komoran/Mecab), English: NLTK -- with POS filtering (noun, verb, adjective, adverb)
5
Collocation Detection
PMI-based multi-word expression detection
6
Stopwords
Remove common stopwords (Korean/English)
7
Lemmatization
Unify inflected forms to their base form (running, ran → run)
8
Keyword Removal
Remove search query keywords to prevent bias

After preprocessing, 6 analyses run automatically

TF / TF-IDF

Word frequency ranking and document-level importance weighting

PMI Collocation

Statistically significant multi-word expressions

Network Centrality

Degree, betweenness, closeness centrality on co-occurrence graph

Topic Modeling (LDA)

Latent topic discovery with interactive pyLDAvis

NRC Sentiment

8 emotions + positive/negative polarity via NRC Lexicon

Word Cloud

Visual representation of term frequency distribution

How Network Compare (QAP/MRQAP) Works

The four-stage protocol of Suh (2026, Systems) — from raw corpora to a publication-ready research model.

1
Corpora
Upload 2–5 corpora (baseline Y + predictors X)
2
Normalize
Union vocabulary + PPMI weighting
3
QAP
Node-permutation structure test
4
Cohen's q
Substantive magnitude of change
5
MRQAP-DSP
Unique contribution β per predictor
6
Robustness
Jackknife · node bootstrap · residuals
7
Model
Path diagram + Methods + Excel

What One Run Produces

QAP Correlation

Structural similarity between networks, tested with 5,000 node permutations (Krackhardt, 1987)

Cohen's q Effect Size

Judges whether change between alignments is substantively large — where thousands of dyads make p-values uninformative

MRQAP-DSP β

Each predictor's unique contribution with overlap removed (Dekker et al., 2007 double-semi-partialing)

Jackknife Diagnosis

Detects suppression effects before you misread a negative β as opposition

Node Bootstrap

1,000 vocabulary resamples — CIs and direction-reproduction rates for every estimate

Research Model Figure

Publication-ready path diagram with β on arrows, 300 DPI export, Methods draft & manifest included

🇰🇷 Korean corpora, done right

  • NLP path: KoNLPy morphological analysis
  • GoEmotions path: local NMT translation (opus-mt-ko-en) before emotion analysis
  • The translation step is recorded automatically in the manifest and the Methods draft

Your data never leaves the server

Inference and translation both run locally on the EmoFEAT server — nothing is sent to external APIs. Usable as-is in research settings where text containing personal information cannot be sent to external LLM APIs (e.g., under IRB review).

An honest comparison

EmoFEAT LIWC Direct LLM coding Custom Python
Emotion granularity 28 categories (GoEmotions) 6–8 dictionary categories Flexible, prompt-defined Any model you build
Reproducibility Pinned model + manifest Deterministic dictionary Run-to-run variance Depends on your discipline
Statistical automation ANOVA to ITS, built in Counts only Not provided You write it
Validation tools (κ/α) Built in Not provided Not provided Libraries exist
Network structure comparison (QAP/MRQAP) Built in — with Cohen's q effect size, DSP and node bootstrap Not provided Not provided UCINET/R packages, assembled by hand
No coding required Web UI Desktop GUI Chat interface Programming required
Data stays local No external APIs Desktop app Sent to API provider If you run it locally
Cost structure Pay per import, analyses unlimited License $100+ Per-token API cost Free — costs your time
Citation track record New tool; model from peer-reviewed literature (GoEmotions, Google Research, ACL 2020) 20+ years of citations Emerging, contested Depends on packages used

As of 2026-07. Each tool has real strengths — pick what fits your study.

Deducted once at import — analyses unlimited

Re-run with different thresholds, regroup and compare again — ₩0. Research is iteration.

10 MB
₩9,900
₩990 per MB
Roughly 50,000 short comments
Valid for 12 months
100 MB
₩69,900
₩699 per MB
Roughly 500,000 short comments
Valid for 12 months

Quota packs are one-time purchases and stay valid for 12 months.

One upload produces a 21-page report and a 16-sheet Excel — share it with your advisor and co-authors right away.

See plans in My Account →

Academic References

Key papers and methodologies used in EmoFEAT

TF-IDF (Term Frequency-Inverse Document Frequency)

Spärck Jones, Karen. "A Statistical Interpretation of Term Specificity and Its Application in Retrieval." Journal of Documentation 28, no. 1 (1972): 11-21. doi:10.1108/eb026526

PMI (Pointwise Mutual Information)

Church, Kenneth Ward, and Patrick Hanks. "Word Association Norms, Mutual Information, and Lexicography." Computational Linguistics 16, no. 1 (1990): 22-29. doi:10.1162/coli.1990.16.1.22

Network Centrality

Freeman, Linton C. "Centrality in Social Networks: Conceptual Clarification." Social Networks 1, no. 3 (1978): 215-239. doi:10.1016/0378-8733(78)90021-7

LDA (Latent Dirichlet Allocation)

Blei, David M., Andrew Y. Ng, and Michael I. Jordan. "Latent Dirichlet Allocation." Journal of Machine Learning Research 3 (2003): 993-1022. ISSN:1532-4435

Sentiment Analysis (Ekman's Basic Emotions)

Ekman, Paul. "An Argument for Basic Emotions." Cognition & Emotion 6, no. 3-4 (1992): 169-200. doi:10.1080/02699939208411068

RoBERTa GoEmotions

Demszky, Dorottya, Dana Mober, Emily Kang, Peter J. Liu, Slav Petrov, and Jeongwoo Ko. "GoEmotions: A Dataset of Fine-Grained Emotions." Proceedings of the 58th Annual Meeting of the Association for Computational Linguistics (2020): 4040-4054. doi:10.18653/v1/2020.acl-main.372

Questions researchers ask first

Why not just ask ChatGPT to code emotions?

For a paper, the problem is not convenience — it is defensibility. LLM coding can return different labels on identical text across runs, model versions get retired, and there is no standard way to report a reliability coefficient. EmoFEAT uses a pinned open model (RoBERTa fine-tuned on GoEmotions; Google Research, ACL 2020), records versions, thresholds and seeds in a manifest attached to every result file, and computes Cohen's κ / Krippendorff's α against your human coders.

Does my data leave the server?

No. Emotion inference and Korean→English translation both run locally on the EmoFEAT server — your text is never sent to external LLM or translation APIs. If your corpus contains personal information and your IRB protocol prohibits sending it to third-party AI services, EmoFEAT can be used as-is. Uploaded files can be deleted from the server at any time.

How does billing work?

Data-volume billing: quota is deducted once at import (by the UTF-8 size of your text column), and every analysis after import is free and unlimited. Re-importing an identical file costs nothing. Packs are 10MB ₩9,900 · 30MB ₩24,900 · 100MB ₩69,900, each valid 12 months. Full table in Help →

How many emotions can it detect?

28 fine-grained emotions from the GoEmotions taxonomy (Google Research, ACL 2020): 12 positive (admiration, joy, love, gratitude, …), 11 negative (anger, sadness, grief, remorse, …), 4 ambiguous (curiosity, surprise, realization, confusion) and neutral — each with a probability score per document.

Can I use the results in SCIE journal papers?

Yes. EmoFEAT generates publication-ready statistics — ANOVA with Tukey HSD, Pearson/Spearman correlations with p-values, K-Means clustering with silhouette scores, entropy analysis and logistic regression — plus a reproducibility manifest and an auto-drafted Methods section, all formatted for academic publication standards.

How do I cite EmoFEAT (BibTeX)?
@software{suh2026emofeat,
  author  = {Suh, Jungho},
  title   = {EmoFEAT: RoBERTa GoEmotions-based
             Fine-grained Emotion Analysis Tool},
  year    = {2026},
  version = {5.5.0},
  url     = {https://emofeat.com}
}
Read the answers in Help →

Start Your Analysis

Choose your analysis method and get started

Need raw data first? Collect YouTube comments directly and use them for GoEmotions or NLP analysis.

Collect Comments